
grading
Turn every score into a teaching action
The work should not end when the scores are entered. A good grading dashboard turns results into reteaching decisions, small groups, examples, and targeted practice.
 Enzo · July 24, 2026 · 8 min read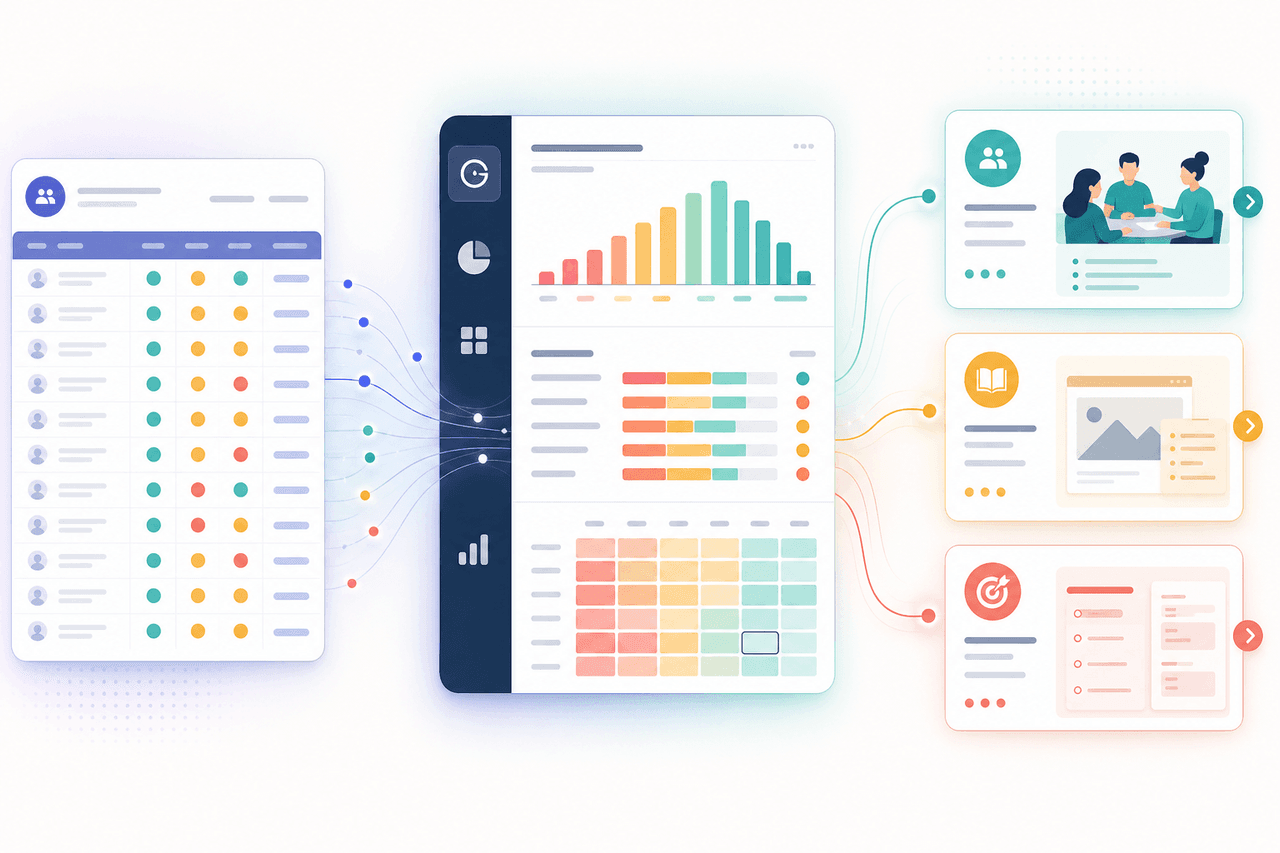
You have just finished grading 22 essays or document-based questions. You know some students struggled, but you are not exactly sure how or why. Tomorrow's lesson is already on your mind. Should you reteach the skill to the whole class, pull a small group, or move on?
That is one of the most frustrating parts of grading. You have done the hard work, but the next instructional move is still unclear. The score is recorded, yet the teaching decision remains.
Averages are only the beginning
A class average is useful, but it is not enough. A 78% average can hide three very different realities: almost everyone is near 78, half the class is thriving while half is stuck, or one rubric criterion is pulling the whole assignment down.
Teachers need distribution, not only average. Who is thriving? Who is falling behind? Which students are on the edge? Which scores are missing? The distribution view helps answer a practical planning question: is this a whole-class issue or a small-group issue?
Rubric breakdowns change the lesson
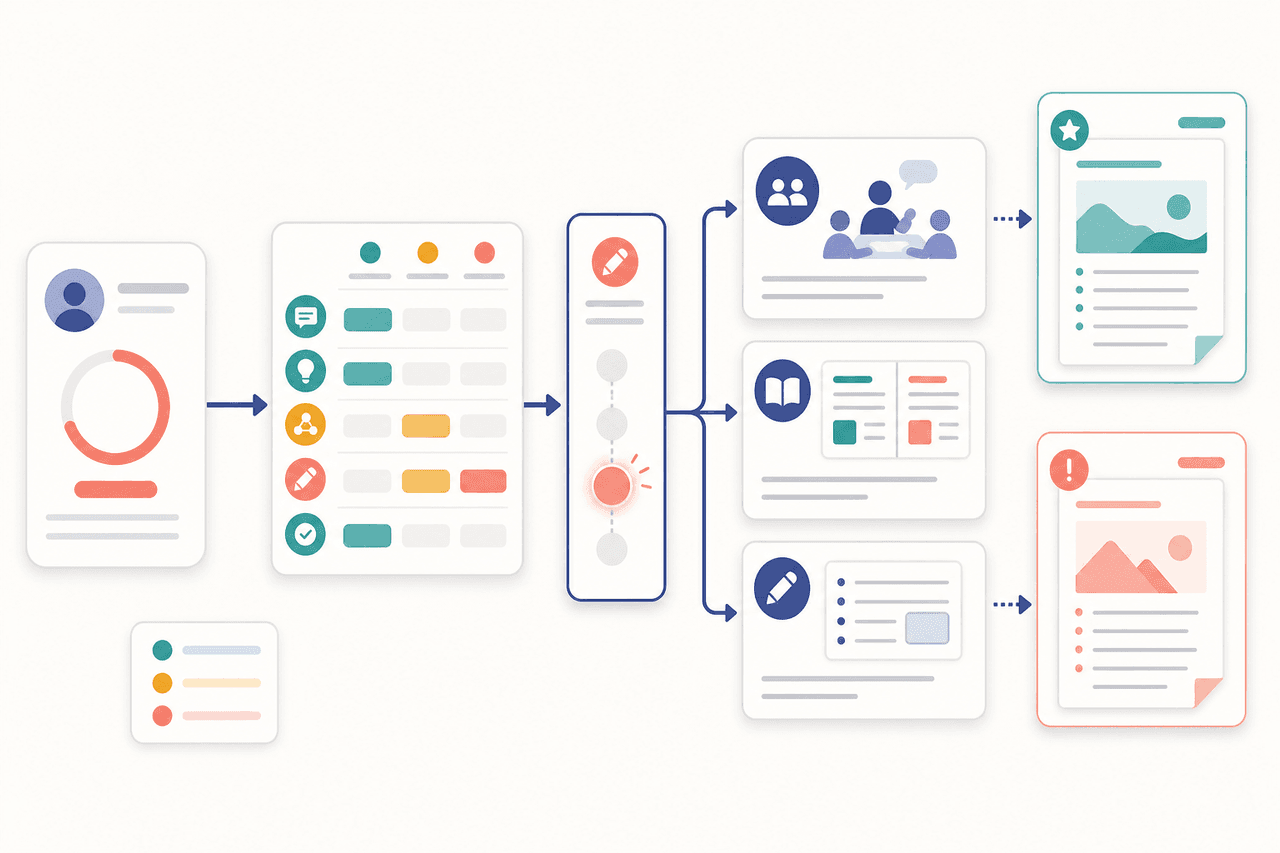
Imagine your students score highly on evidence selection but struggle with explaining why the evidence matters. That single insight changes tomorrow. You do not need to reteach the whole assignment. You need to model explanation.
This is the difference between grading and teaching with precision. A criterion-level view shows whether the issue is thesis, evidence, analysis, organization, vocabulary, method, accuracy, or explanation. The smaller the signal, the better the intervention can be.
Student-by-student views support grouping
A good analytics workflow should let the teacher see each student's strengths and gaps by criterion. That makes small groups faster to build. Instead of manually sorting papers, the teacher can see which students need the same support.
The goal is not to label students permanently. It is to make tomorrow's support specific: these four students need help moving from description to analysis; these three need a model of a stronger claim; these five are ready for extension.
Examples matter as much as numbers
Numbers tell you where the issue is. Examples help you teach it. If the dashboard can surface real examples of strong work and developing work, the teacher has something concrete to model.
This matters because students often need to see the difference, not just hear it. "Explain the evidence more" is abstract. Showing a developing explanation next to a stronger one makes the next step visible.
The best analytics create resources
Once you know the small group and the missing skill, the next task is creating the material. That is where AI can help again. It can draft a short practice set, a mini lesson, a comparison example, or a targeted worksheet based on the actual gaps in the class.
The teacher still decides what to use. But the tool can remove the blank-page problem. No copying scores into another prompt. No manually sorting the class. No starting from scratch after you already graded the assignment.
Grading should start the next lesson
The clean workflow is simple: grade the assignment, open the class view, see the patterns, choose the next move, and create the resource. In that workflow, grading is not the final step. It is the starting point for better teaching.
That is why analytics are part of the Grade Coach direction. The value is not just a faster score. The value is knowing what to teach next, who needs it first, and what evidence makes that decision clear.